Android: How to Track All Methods in a Class
When your application gets bigger, it would be hard to know who calls a method and when it is called. If you want to know it, you can print logs using Log class. As described in the previous post, breakpoints can be used for logging without changing your code. However, if there are many methods, both ways are kind of cumbersome. You need to either add Log.x or set a breakpoint for every method you want to track.
Fortunately, Android Studio supports to set method breakpoints using a pattern. Let’s say you want to track every method in this class.
public class MainActivity extends AppCompatActivity {

  @Override
  protected void onCreate(Bundle savedInstanceState) {
    super.onCreate(savedInstanceState);
    setContentView(R.layout.activity_main);
  }

  @Override
  protected void onStart() {
    super.onStart();
    showToast();
  }

  @Override
  protected void onResume() {
    super.onResume();
  }

  public void showToast() {
    Toast.makeText(this, "Welcome", Toast.LENGTH_SHORT).show();
  }
}
When you add a breakpoint for a single method or line, you can do it by clicking the gutter next to the line number. Whereas, you can set method breakpoints with a pattern in Run > View Breakpoints... menu.
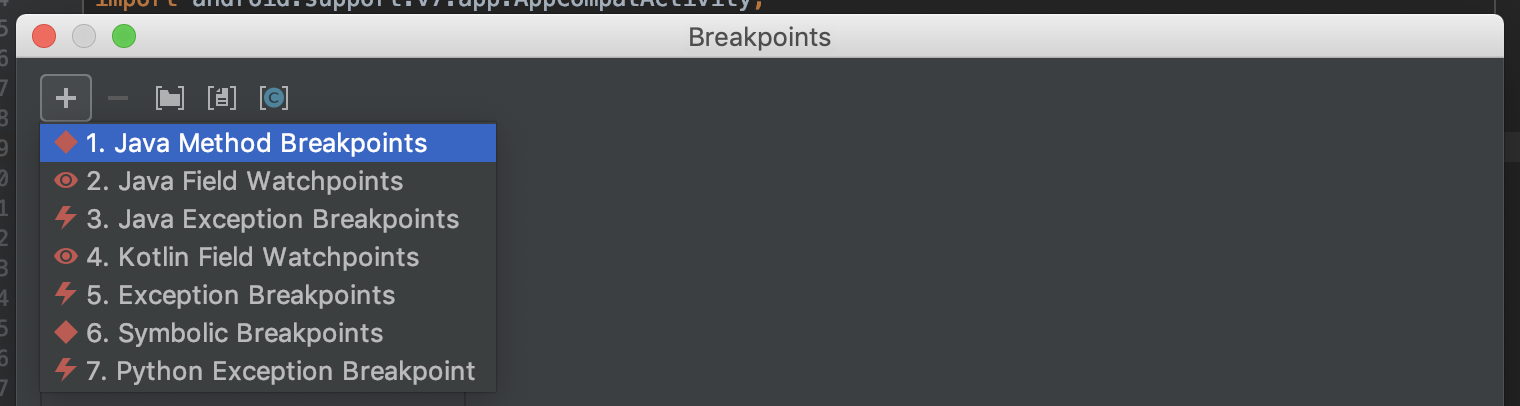
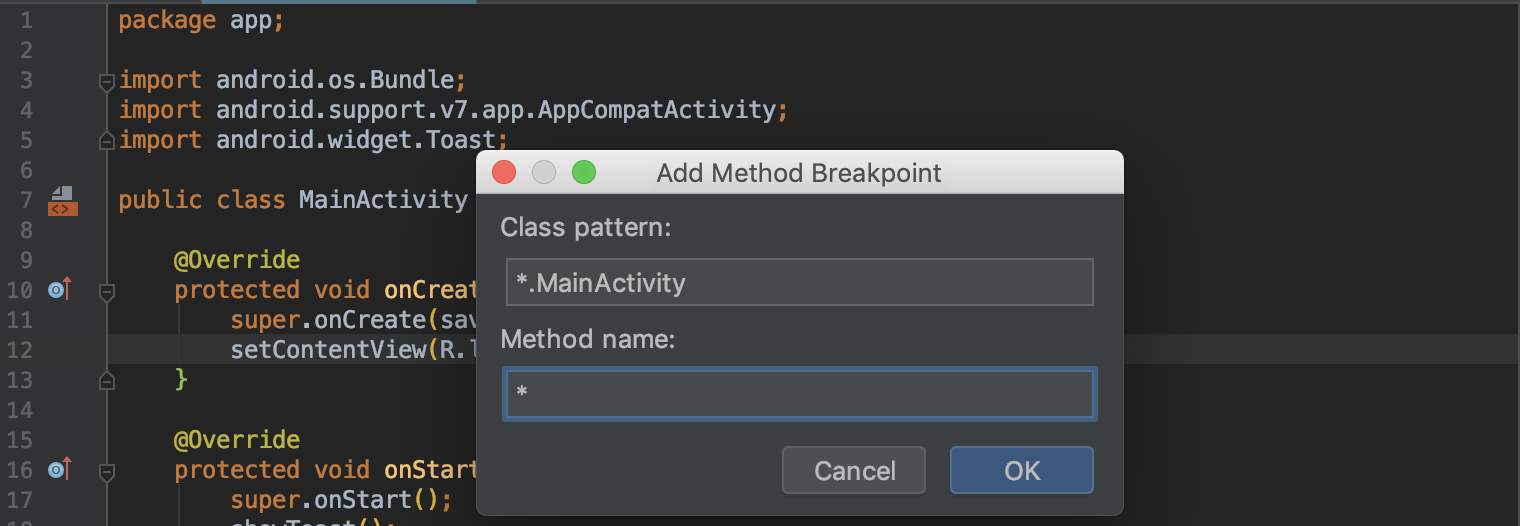
After opening the menu, click the + > Java Method Breakpoints. As you can see, you can add also track fields or exceptions. Then, write down a class pattern and method name. The pattern supports the * wildcard.
When you create a method breakpoint, you can configure below options.
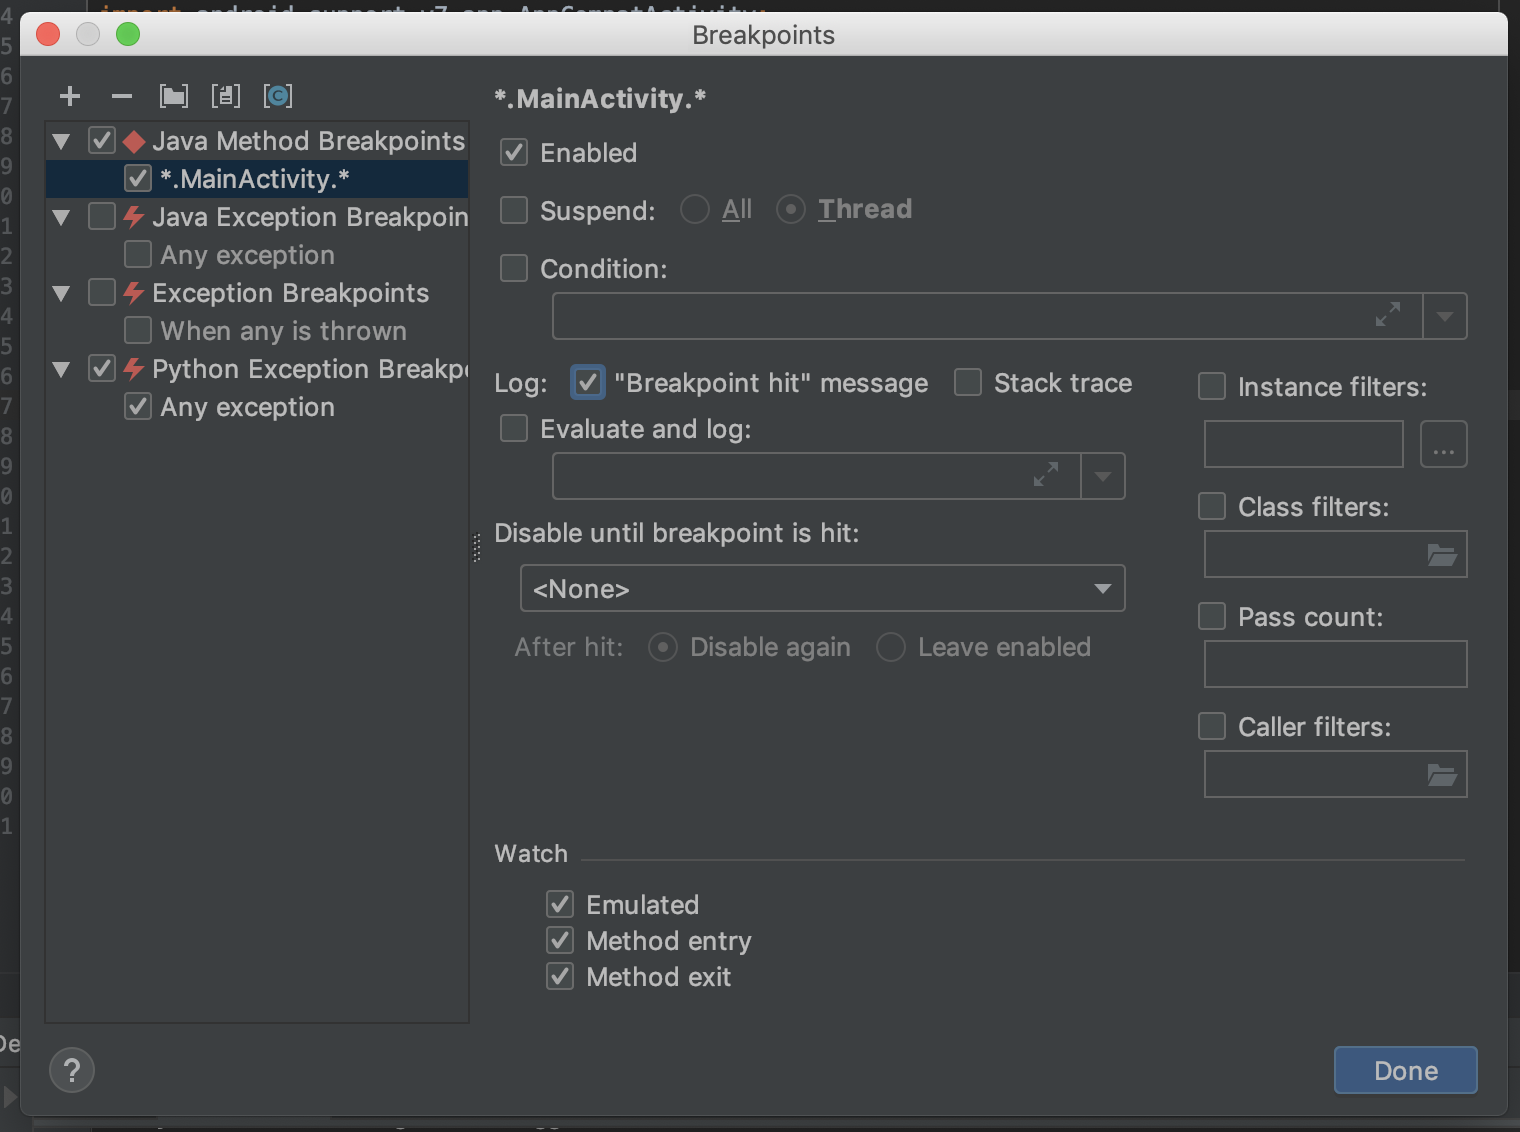
- Suspend: Select to pause the program execution when a breakpoint is hit
- “Breakpoint hit” message: a log message will be displayed in the console output when the breakpoint is hit.
- Stack trace: the breakpoint’s stack trace will be printed to the console when it’s hit.
- Method entry: Select to trigger the breakpoint each time the method is entered.
- Method exit: Select to trigger the breakpoint each time the method is exited.
In most cases, you don’t need to change Emulated option. If you want to know what it is, here is the official description.
Emulated: This option is set by default when you create a method breakpoint. Instead of using a slow method breakpoint, IntelliJ IDEA sets a combination of line breakpoints at first statements of all implementing or overriding methods that emulate a method breakpoint.
We only recommend to deselect this option if you are debugging a remote code (as emulated breakpoints can be very slow to set), or if you need to set a breakpoint at methods without the line number information.
In here, “Breakpoint hit” message is selected with a method entry and exit. When you debug the app, you can see log messages in Debug > Console tab. <init> is a constructor, and there are enter and exit logs.
Method 'app.MainActivity.<init>()' entered at app.MainActivity.<init>(MainActivity.java:7)
Method breakpoint reached. Method 'app.MainActivity.<init>()' is about to exit at app.MainActivity.<init>(MainActivity.java:7)
Method 'app.MainActivity.onCreate()' entered at app.MainActivity.onCreate(MainActivity.java:11)
Method breakpoint reached. Method 'app.MainActivity.onCreate()' is about to exit at app.MainActivity.onCreate(MainActivity.java:13)
Method 'app.MainActivity.onStart()' entered at app.MainActivity.onStart(MainActivity.java:17)
Method 'app.MainActivity.showToast()' entered at app.MainActivity.showToast(MainActivity.java:27)
Method breakpoint reached. Method 'app.MainActivity.showToast()' is about to exit at app.MainActivity.showToast(MainActivity.java:28)
Method breakpoint reached. Method 'app.MainActivity.onStart()' is about to exit at app.MainActivity.onStart(MainActivity.java:19)
Method 'app.MainActivity.onResume()' entered at app.MainActivity.onResume(MainActivity.java:23)
Method breakpoint reached. Method 'app.MainActivity.onResume()' is about to exit at app.MainActivity.onResume(MainActivity.java:24)