Android: Analyze Stack Trace from Plain Text Log
A stack track is a report that shows the stack frames at a certain point. When you debug your application, this is useful to know how to this method is called. This is even useful when a crash happens. At that time, you need to know what happened. A stack track can show how to end up having a crash. By analyzing it, you can find the root problem in your application.
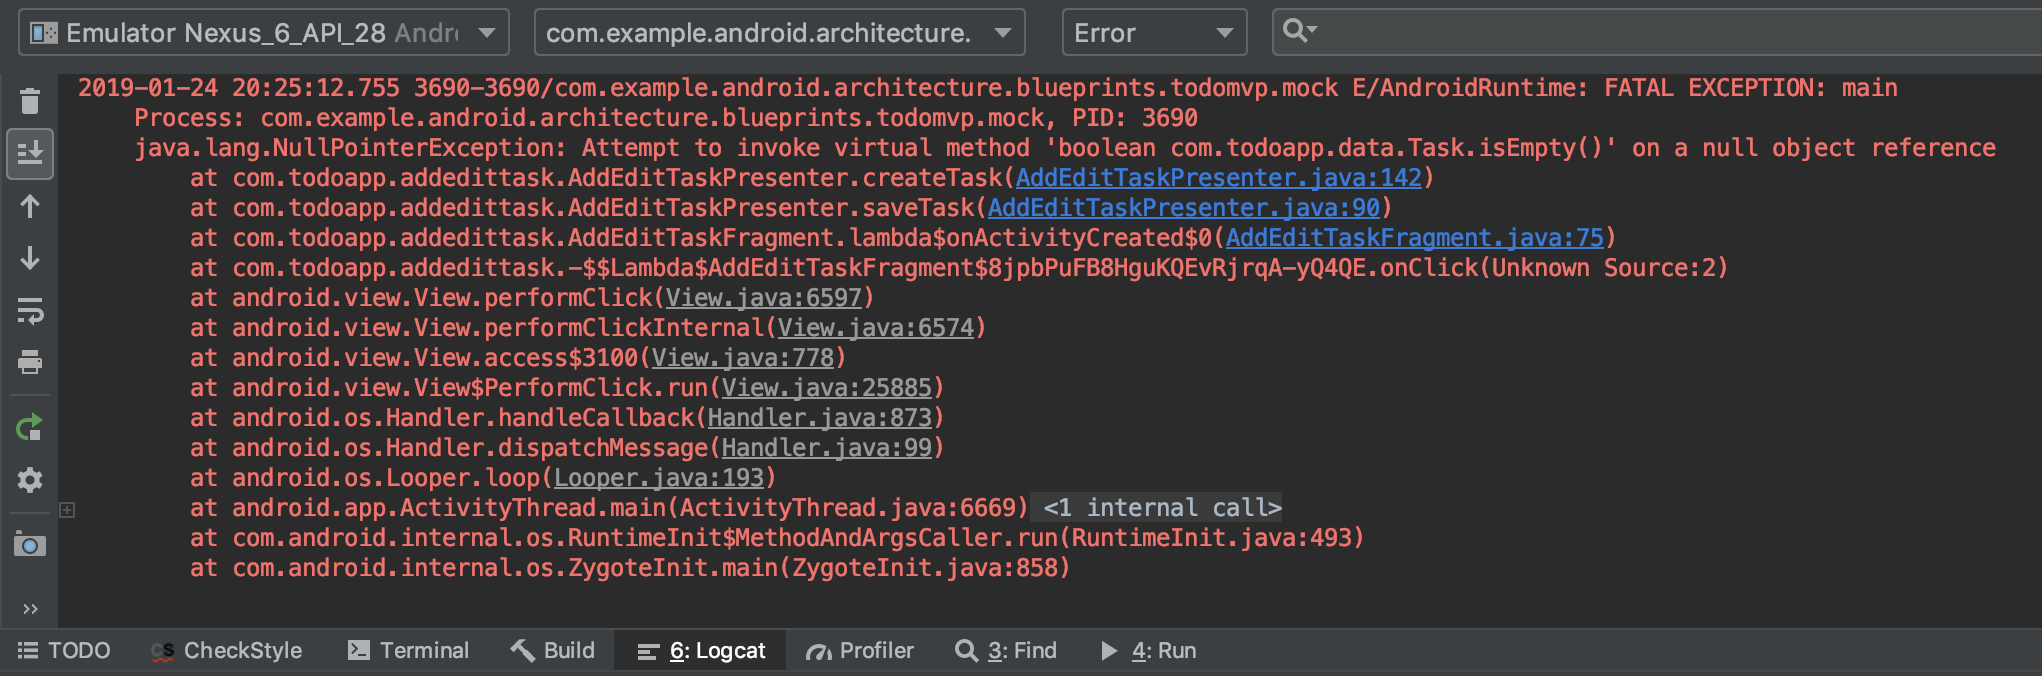
When you have a crash issue while developing, you can see it in the Logcat tab in Android Studio. In the log, there are blue and grey texts, which tell you the file and line information on that stack frame. The blue means that stack frame is in your source code. Whereas, the grey means that it is in a third-party library or framework code. By clicking it, you can easily navigate.
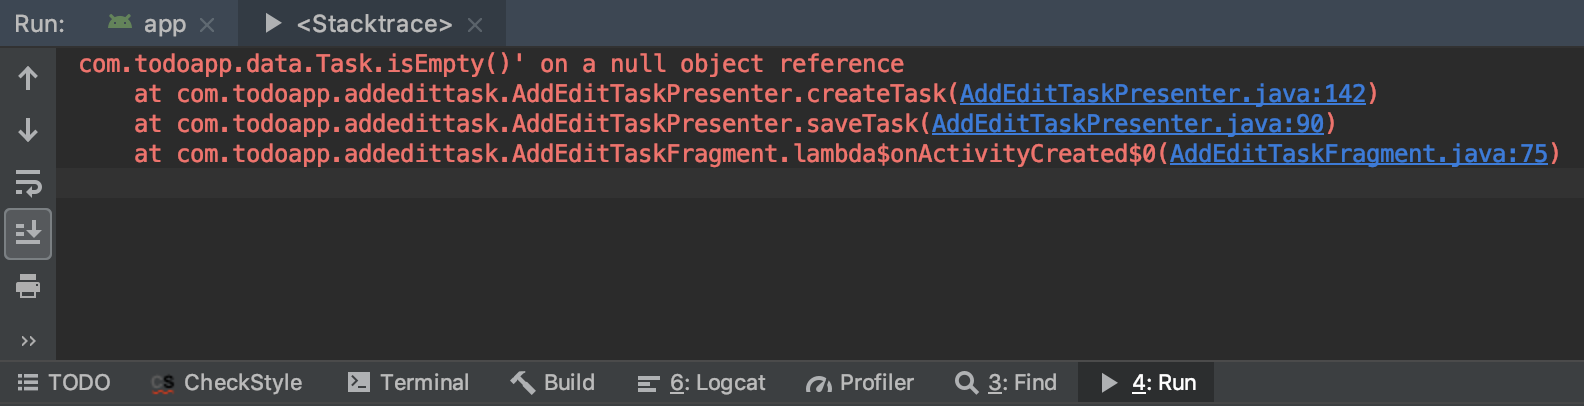
Crashes can happen not only when you are using Android Studio but also when anytime. Someone can report an issue with a log. Or, you can see them on the crash reporting tool such as Fabric. For both cases, you will see the plain text log like below since that didn’t happen in the Android Studio.
java.lang.NullPointerException: Attempt to invoke virtual method 'boolean com.todoapp.data.Task.isEmpty()' on a null object reference
    at com.todoapp.addedittask.AddEditTaskPresenter.createTask(AddEditTaskPresenter.java:142)
    at com.todoapp.addedittask.AddEditTaskPresenter.saveTask(AddEditTaskPresenter.java:90)
    at com.todoapp.addedittask.AddEditTaskFragment.lambda$onActivityCreated$0(AddEditTaskFragment.java:75)
From this log, you can navigate the file and line manually and one by one. If you want to see a below stack frame, you can open another file and go to that line. This is absolutely doable but a bit cumbersome. When a crash happens while developing, it is really easy to navigate since you just need to click. For that plain text log, Android Studio supports to convert it clickable after parsing. Open Analyze > Analyze Stack Trace... menu. Then, paste the log and click OK.
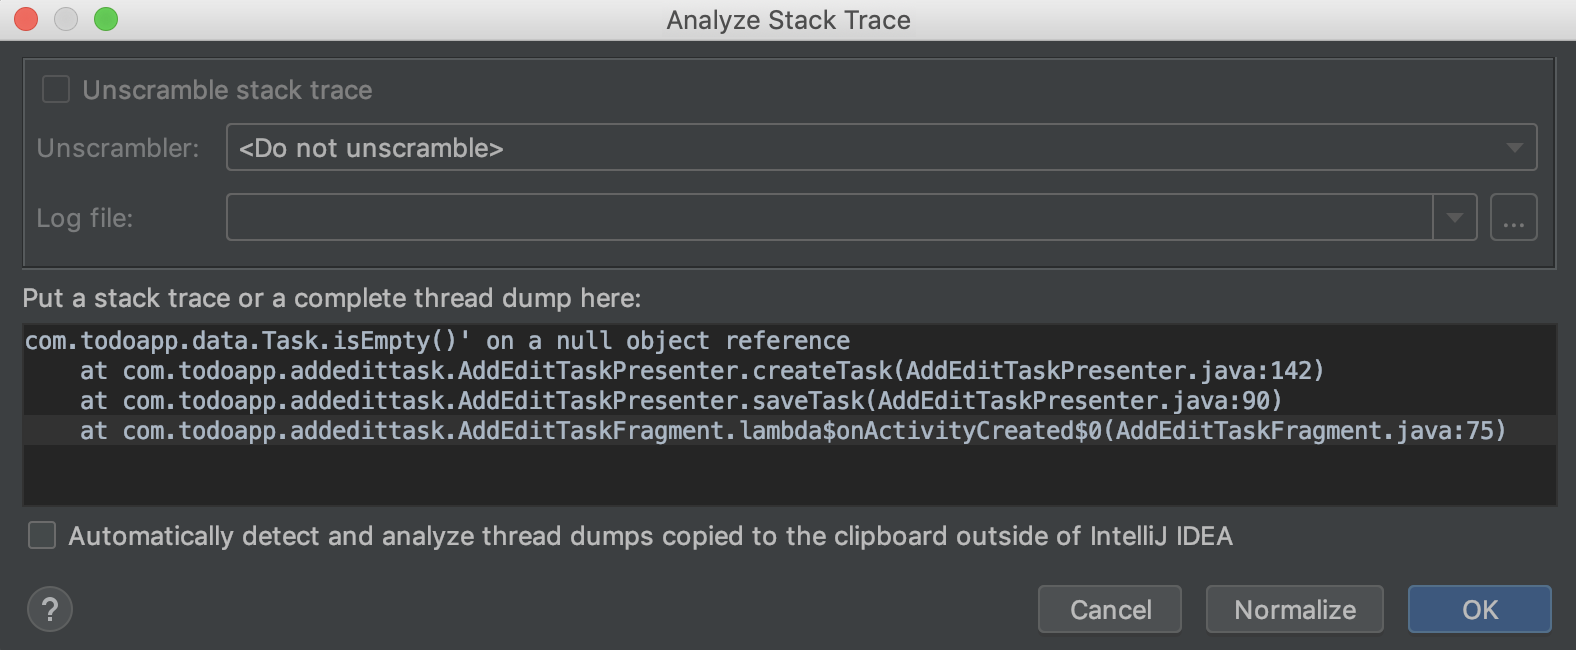
The parsed stack trace will be shown and you can now easily navigate. If you analyze the plain text log a lot, you can turn on the Automatically detect and analyze option. With that, Android Studio show the parsed stack trace without opening the menu.